Tracking Qantas Wine Bonus Point Deals
Qantas Wine is a marketplace where you can purchase wines using either cash or Qantas points. Some offers even allow you to earn bonus Qantas points, making it a popular choice for those looking to boost their point-earning strategies.
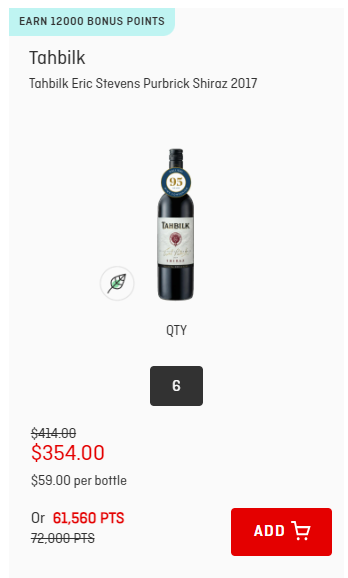
For example, spend $354.00 on 6 bottles of this Tahbilk (priced at $59.00 per bottle), and you will receive 12k Qantas points. This equates to earning bonus points at 2.95 cents per point.

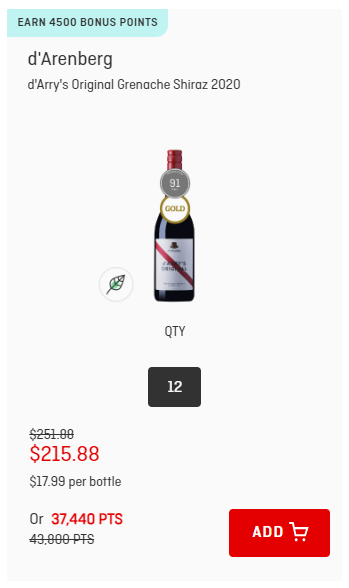
Alternatively, spend $215.88 on this 12 pack of d’Arenberg (priced at $17.99 per bottle), and you will receive 4.5k Qantas points. This equates to 2.8 cents per point, but with the benefit of not having to fork out $59.00 for a bottle of wine.

Currently there are a couple of websites (here and here) that track and display the wines sorted by Cents Per Point earned. However, not everyone is willing to buy an $80 bottle of wine to receive points at the best rate!
So I decided to build my own tracking and reporting tool that shows both metrics (Cents Per Point and $/bottle) to make a more informed decision. This way, you can easily balance point-earning potential with the price of the bottle that suits your budget.
The dashboard
Link to dashboard HERE
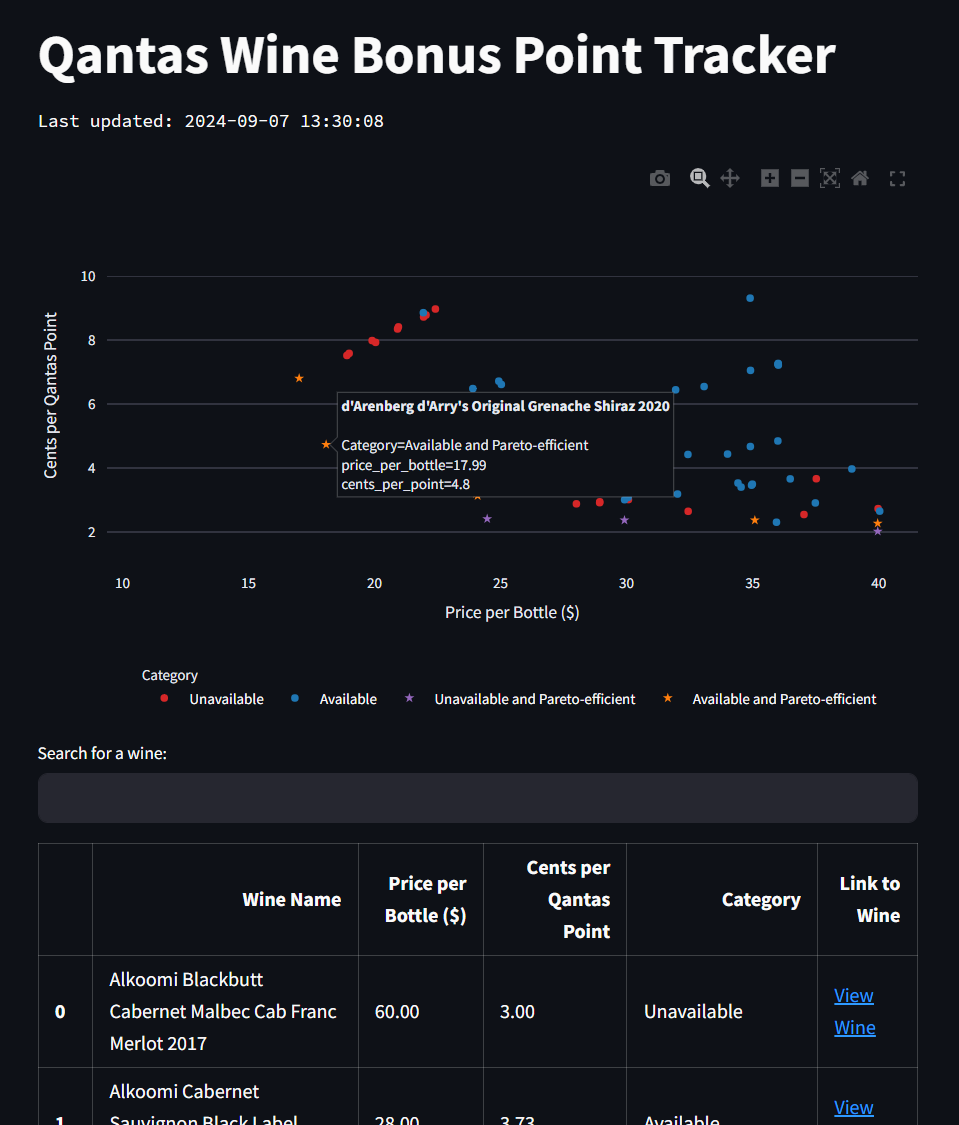
The dashboard plots wine prices (per bottle) against the corresponding Cents per Point earned in a scatter plot, making it easier to spot the ‘sweet spots.’
The dashboard’s wine database is refreshed automatically every few hours by a scraping script that pulls data from the Qantas Wine store.
Both historical and current bonus point offers are displayed, helping you see whether current promotions are a good deal or if it’s better to wait for something better.
I’ve also highlighted Pareto efficient wines using star markers. A Pareto efficient wine is one where no other wine has both a lower price and a lower cost per point. In other words, it represents the best trade-off. You can’t lower one attribute (like price) without increasing the other (like cost per point). I came across this concept in a great article (link) that uses it to select the best Mario Kart character.

Dashboard build (technical)
The dashboard is built using Streamlit, an open-source Python library that makes it quick and easy to create interactive web based applications and dashboards for data science and reporting.
The Python code is hosted on my personal GitHub repository, with the app deployed via Streamlit Cloud. This setup ensures the app automatically pulls updates from the repo to stay current with any changes.
I used Streamlit’s secrets feature to store the Google Drive URL where the (web-scraped) wine database is stored, allowing me to control how the data is accessed without giving unfettered access to an unknown user base.
Dashboard code repo: https://github.com/sc0h0/streamlit_qantaswine
Scraping and ETL (technical)
This was the most time-consuming part of the app!
The wines with bonus point offers are listed at this URL: https://wine.qantas.com/c/browse-products?BonusPoints=1.
Unfortunately, it uses a dynamically rendered JavaScript table rather than a static HTML table.
Nonetheless, I was able to extract the wine information by locating the JSON data embedded in the page. The extracted JSON data was then saved as daily CSV snapshots. A Type 2 Slowly Changing Dimension was implemented to allow me to track both historical and current pricing attributes.

The code to scrape the Qantas Wine store and prepare the SCD table is here: https://github.com/sc0h0/streamlit_qantaswine/tree/main/scrape_code
This code runs every few hours via a Windows Task Scheduler job on an old laptop, ‘Betty,’ tucked away behind my TV cabinet. Sure, I could have gone with a fancy virtual Unix machine and used a cron job instead, but this was a cheaper (considering $ per kWh vs virtual server costs) and simpler option.